This piece checks a viral claim against real market data, then covers what’s actually happening across Korean, US, and other Asian markets this week — the real numbers, the real causes, and what the real risk factors going forward actually are.
First: checking the viral claim
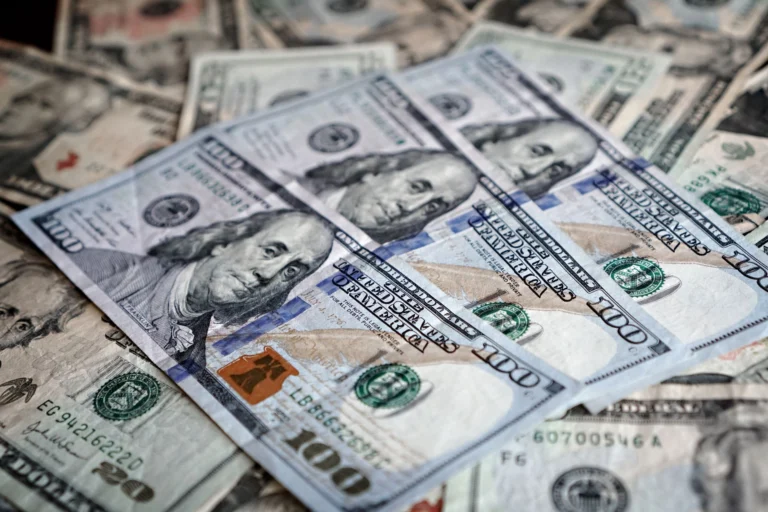
A post circulating widely today claims over ₩100,000,000,000,000 (100 trillion won) was wiped off the Korean stock market in 20 minutes, that AI stocks are “dumping hard,” and that South Korea is preparing to halt trading to stop a collapse. Here’s what the real data actually shows: on August 28, 2026, South Korea’s KOSPI index fell 1.16%, closing below 6,900 points at 6,831.99 — a real, meaningful decline driven by profit-taking in AI chip stocks after Nvidia’s earnings, foreign capital outflows, and currency pressure (the won trading around 1,380 to the dollar). That is a genuine down day. It is not a 20-minute collapse, and there is no evidence of an imminent trading halt today.
The “20 minutes” detail in the viral claim is real — it just isn’t from today. South Korea’s KOSPI genuinely did trigger a Level 1 circuit breaker on July 28, 2026, after plunging more than 8% in a single session, which automatically halts all trading for exactly 20 minutes under Korea Exchange rules. That was the eighth circuit-breaker trigger of the year at the time, part of a real, historic crash that unfolded across July. The specific mechanics in the viral post are accurate descriptions of a real event — they’re just being recirculated as if they describe today, which they don’t. This is a genuinely common pattern with viral finance content: real numbers from a real past event, stripped of their original date, and re-shared during a smaller, unrelated down day to manufacture urgency.
The real story: Korea’s actual, historic 2026
None of this means Korea’s market has been calm in 2026 — the real story is dramatic enough without exaggeration. In late July, the KOSPI plunged 44% from its June peak, wiping out more than $2 trillion in market value in roughly five weeks — the worst crash in the exchange’s history. Samsung Electronics lost 21% of its value that month; SK Hynix, the world’s second-largest memory chipmaker, fell 35%.
The real mechanism behind the severity of that crash is worth understanding on its own: earlier in 2026, South Korean regulators approved single-stock leveraged ETFs, letting retail investors amplify their bets on individual tech giants like Samsung and SK Hynix — meaning a 2x leveraged product would gain or lose roughly twice the underlying stock’s actual daily move. When AI-chip enthusiasm cooled and prices started dropping, that leverage worked in reverse with real force: a decline that would have been a manageable single-digit loss on the underlying stock became a much larger loss on the leveraged position, which meant investors who had put up borrowed money or margin to hold those positions got hit with automatic margin calls — demands to add more cash or have the position forcibly sold.
The real, mechanical problem is what happened next: brokers forcibly liquidating those leveraged positions meant more shares hitting the market as sell orders, which pushed prices down further, which triggered the next tier of margin calls on other leveraged holders, in a real, self-reinforcing feedback loop. That’s the specific mechanism that turned what started as a normal, ordinary correction in AI-chip enthusiasm into a historic, index-wide rout — not the initial price drop itself, but the leverage-driven forced selling that the initial drop set in motion. Some retail accounts reportedly ended up with negative balances, owing money beyond what they’d originally invested, a real and severe outcome that’s genuinely uncommon for ordinary retail stock ownership without leverage involved.
Then came a real, equally dramatic reversal: on August 1, 2026, the KOSPI gained 1,001.89 points in a single session — a 17.91% jump, the largest single-day percentage gain in the index’s history. Since then, the market has stayed genuinely volatile rather than settling into a clear direction: real down days (KOSPI fell more than 3% on August 24, and 4.6% on August 6) have alternated with real rebounds (a roughly 1.7% gain on August 26, tied to Samsung and SK Hynix share buyback hopes). Today’s 1.16% decline fits squarely inside that same real, ongoing volatility — a genuine down day in a genuinely turbulent year, not a new standalone collapse.
How bad the July crash actually got, in real numbers
It’s worth sitting with the real scale of what happened in late July, because it’s genuinely one of the more dramatic single-month market events anywhere in the world this year. Real reporting put the amount of leveraged-ETF positions forcibly liquidated during the crash at roughly ₩2.3 trillion — real retail investor money, wiped out specifically by the mechanical margin-call process described above, not by a deliberate investment decision anyone made in the moment. The situation escalated far enough that South Korea’s president personally stepped in with an emergency intervention, and Finance Minister Koo Yun-cheol issued a real, public apology to lawmakers, acknowledging that single-stock leveraged ETFs had been approved and launched without sufficiently careful consideration of the risk they introduced.
The government’s response went beyond words: a real $14 billion sovereign wealth fund was deployed to help stabilize the market during the worst of the rout — a genuine, large-scale state intervention, not a symbolic gesture.
The real regulatory crackdown that followed — and why it matters for what comes next
In the aftermath, Korean regulators moved fast and specifically, and this is a real, important piece of the “what to expect going forward” picture. The Financial Services Commission halted approval of any new leveraged ETFs outright, and floated real proposals to restrict leveraged-ETF access to professional investors only, or to lower the maximum leverage multiple allowed on single-stock products, pending legislation.
The concrete restrictions that actually took effect were substantial: the minimum cash deposit required to trade these products roughly tripled, from ₩10 million to ₩30 million, and new investors are now required to complete three hours of mandatory education plus five consecutive days of simulated trading, at least an hour a day, before they’re allowed to trade real leveraged positions. The real, measurable effect of these changes shows up directly in trading volume: daily turnover in leveraged ETF products collapsed from ₩12.4 trillion on July 30 to just ₩700 billion by August 11 — a genuine, documented decline of more than 90% in barely two weeks.
That matters directly for assessing today’s situation and any future volatility: the exact mechanical amplifier that turned a normal correction into July’s historic 44% crash has been real, substantially defanged by regulators since then. That doesn’t mean Korean markets can’t fall sharply again — today’s 1.16% decline is proof they still move — but the specific forced-liquidation feedback loop that made July so extreme is a genuinely smaller factor now than it was a month ago.
What a Korean trading halt actually requires — and why today doesn’t qualify
It’s worth explaining the real mechanics here directly, since the viral claim leans on the idea that a halt is imminent. The Korea Exchange runs a real, specific three-stage circuit breaker system, and the thresholds are exact, not subjective. A Level 1 halt triggers only when the KOSPI falls 8% or more from the previous close and stays at that level for a full continuous minute — resulting in an automatic 20-minute pause. If the decline keeps deepening to 15% or more, a Level 2 halt triggers, another 20-minute pause. At a 20% decline, Level 3 triggers an immediate close of the market for the rest of the day. There’s a real, additional rule that circuit breakers can’t activate at all in the final 40 minutes of a trading session, and only one circuit breaker of each level can trigger per day.
Today’s real decline — 1.16% — isn’t close to the 8% threshold that would trigger even the first, mildest halt level. For context, the actual Level 1 halt on July 28 required an 8.02% single-day plunge, a real, specific, and comparatively rare event — it was only the eighth time that had happened across the entire year at that point, itself a sign of how unusual conditions were during that specific stretch. A 1.16% move, however real, sits well within the range of a normal daily fluctuation for any major global index, nowhere near circuit-breaker territory.
Why AI chip stocks specifically keep swinging
Samsung and SK Hynix aren’t moving on Korea-specific news alone — both are deeply tied to global AI infrastructure demand, particularly high-bandwidth memory chips used in AI data centers, which makes them genuinely sensitive to sentiment shifts around US AI giants like Nvidia. That link is exactly what shows up in today’s real KOSPI move: the decline was specifically attributed to profit-taking in AI chips following Nvidia’s latest earnings report.
Nvidia’s own results this week were genuinely strong on paper — the company beat estimates on revenue, earnings per share, and issued guidance for continued strength. But the market’s reaction has been real and mixed rather than uniformly celebratory: alongside days of gains tied to that strong outlook, there have also been real, reported pullbacks of nearly 5% in Nvidia’s own stock, and broader chip-stock weakness, tied specifically to renewed Wall Street worries about “circular financing” in the AI buildout — deals where AI companies, chipmakers, and cloud providers are financing each other’s purchases and infrastructure commitments in ways that inflate reported demand without necessarily reflecting equivalent new end-user revenue. That combination — a real earnings beat, alongside real skepticism about what’s actually funding the AI infrastructure boom — is producing exactly the kind of whipsaw price action AI-linked stocks have shown across Korea, the US, and elsewhere this week.
What the rest of the market actually looked like this week
Beyond Korea, the real regional picture as of today is mixed rather than uniformly negative — worth noting directly, since the viral claim implies a broad, synchronized global collapse that the data doesn’t support. Japan’s Nikkei was genuinely positive today, improving through the morning session. Taiwan’s TAIEX also held a real gain, even as it eased off a stronger opening move. Hong Kong’s Hang Seng opened modestly lower but erased that early loss as the session progressed, while mainland China’s Shanghai Composite opened essentially flat, offering neither a further drag nor a rescue for regional sentiment. Korea was the real, specific outlier to the downside among major Asian indices today — not the leading edge of a region-wide rout, but a genuinely isolated case tied to its own specific AI-chip exposure and currency pressure.
In the US, the picture across this same week has been genuinely volatile in both directions rather than a one-way decline: real down days tied to bond yields and oil prices earlier in August gave way to real up days later in the month, including a three-day win streak for the Dow around August 24 as Treasury yields retreated. The days immediately around Nvidia’s earnings release produced real, substantial single-session swings in both directions across the Nasdaq and S&P 500 — consistent with a market genuinely trying to price in strong AI fundamentals against real, simultaneous doubts about the financing structure underneath the AI buildout, not consistent with a synchronized global selloff.
The real divergence underneath those headline index moves is itself informative: this wasn’t a uniform “AI stocks down” story even within the US market. Software companies with direct AI product revenue posted real, substantial gains around Nvidia’s report — Okta reportedly surged roughly 28% and Salesforce rose about 22% in the same window that chip-adjacent names like Marvell Technology fell more than 7% on its own earnings report. That split — AI software winners moving sharply higher while AI hardware and infrastructure names traded much more nervously — is a real, specific signal that the market’s concern is concentrated on the capital-intensive infrastructure and chip layer of the AI buildout specifically, not on AI-driven revenue growth as a broader concept.
The real, deeper concern actually worth tracking
Underneath the day-to-day price swings, there’s a genuine, substantive debate happening among serious analysts and institutions — and it’s worth separating this real concern from the viral post’s exaggerated framing, because the real version is more useful and more measured. The Bank for International Settlements has flagged real concern about how fast AI-related valuations, infrastructure spending, and debt-financed expansion have grown — not a prediction that AI itself will fail, but a real warning that market expectations for revenue, productivity gains, and investment returns may be running ahead of what companies can actually deliver on a realistic timeline.
The “circular financing” concern specifically centers on the real scale of vendor-financing arrangements now underpinning AI infrastructure buildouts — deals like Oracle’s reported $300 billion, five-year agreement tied to OpenAI’s data center expansion are real, documented examples of AI companies and their infrastructure partners financing each other’s growth in ways that can make demand look stronger than it might be on a fully independent basis. CNBC’s Jim Cramer has drawn a direct, public comparison between this pattern and the vendor-financing arrangements that preceded the dot-com crash of the early 2000s — a real, historically-grounded parallel, not a new or fringe concern.
The real scale involved is genuinely large: the five biggest US hyperscalers are on pace to spend more than $1 trillion combined on AI-related capital expenditure across 2025 and 2026, with 2026 alone potentially exceeding $700 billion. Debt tied to that buildout — particularly off-balance-sheet obligations — has reportedly surged past $3 trillion. Those are real, documented figures describing a genuinely unprecedented scale of infrastructure investment, financed in ways that are drawing real, legitimate scrutiny from serious analysts, independent of any single day’s stock price move.
What to actually expect in the coming days
The honest answer is that nobody can predict short-term price moves with real accuracy, and any piece claiming otherwise is selling certainty markets don’t actually offer. What can be said with real confidence, based on the patterns already documented above: continued volatility in AI-linked stocks specifically is a reasonable expectation, not a wild guess — the underlying tension (strong reported AI demand and earnings, set against real, unresolved questions about circular financing and long-term return on this scale of capital expenditure) hasn’t been resolved by any single earnings report or single trading day, and markets tend to keep repricing an unresolved tension like that rather than settling immediately.
Korea specifically remains a real, higher-volatility case relative to other major markets this year, given the leveraged-ETF mechanism that amplified July’s crash is still in place — meaning a future sharp move, in either direction, has a real, structural reason to potentially be amplified the same way it was during the July collapse. That’s a genuine, mechanical risk factor worth tracking, distinct from the specific (and today, inaccurate) claim that a collapse is happening right now.
More broadly, the real, larger-scale questions raised by institutions like the BIS — about whether AI infrastructure spending and its financing structure are sustainable at current growth rates — are not the kind of thing that resolves in days. They’re the kind of structural question that typically plays out over quarters, as actual revenue and usage data either catches up to the spending, or doesn’t. Anyone using this week’s real volatility to make short-term trading decisions should weigh that real, well-documented uncertainty rather than either the viral panic framing or an equally unwarranted assumption that today’s dip is meaningless noise.
How to actually evaluate a viral market claim like this one
The specific pattern in today’s post is worth naming, because it’s genuinely common and genuinely checkable in a few minutes. Three real, practical questions catch most exaggerated or recycled market claims: First, does the specific number match a real event, and if so, when did that event actually happen — a reverse image or phrase search on the exact figure (in this case, the won amount and the “20 minutes” detail) often surfaces the original, correctly-dated reporting within seconds. Second, is there a real, current index level or percentage move attached, or just an alarming total dollar or currency figure — a claim that skips the actual percentage change and jumps straight to a huge absolute number is a common way to make an ordinary move sound catastrophic, since even a small percentage decline produces a large absolute figure on an index worth trillions. Third, does the claim describe something that would be independently, immediately verifiable through official channels — a real trading halt shows up instantly on the Korea Exchange’s own public market status page and gets picked up within minutes by every major financial wire service, so a genuine halt is never something that stays confined to a single viral post without broader confirmation.
Applying that same three-question check here: the ₩100 trillion figure and the “20 minutes” detail both trace back to real, but differently-dated, events; today’s actual move was a specific, checkable 1.16% decline, not an unattached dollar figure; and no wire service or the Korea Exchange itself reported a trading halt today. That’s a genuinely fast, repeatable way to separate real market news from recycled panic content, and it’s worth applying to the next viral market claim just as much as this one.
The honest takeaway
The real news today is genuinely worth understanding: Korea’s KOSPI fell a real 1.16% on real profit-taking tied to Nvidia’s earnings, part of a genuinely volatile year that included a real, historic 44% crash in July and an equally real, record-setting 17.91% single-day rebound days later. AI-linked chip stocks globally are genuinely swinging on a real, substantive tension between strong reported demand and real, serious analyst concern about circular financing propping up that demand. None of that supports the viral claim of a 100-trillion-won, 20-minute collapse or an imminent trading halt today — that specific claim recycles real details from a genuine event that happened a month earlier, presented as breaking news. The real story, without the exaggeration, is dramatic enough on its own — and understanding the real, documented version is a lot more useful than reacting to a recycled panic post.
If your company or product is mentioned in this article, you're welcome to share it.